How Team Performance works
Team Performance shows what each person and department delivered in a period. You find it in Analytics → Team Performance.
It has no data of its own. It reads tasks, objectives, KPIs, metrics and the work reports people add inside tasks. Nobody fills in a separate report.
For example, on Monday a Head of Delivery opens Team Performance and sees who is behind plan, which objectives are at risk and how much of the team's time went to standalone tasks.
Choosing a period and a department
Choose the period at the top, for example 1 to 31 October. The tabs below switch between the whole company and each department. Use search to find a person.
Employees
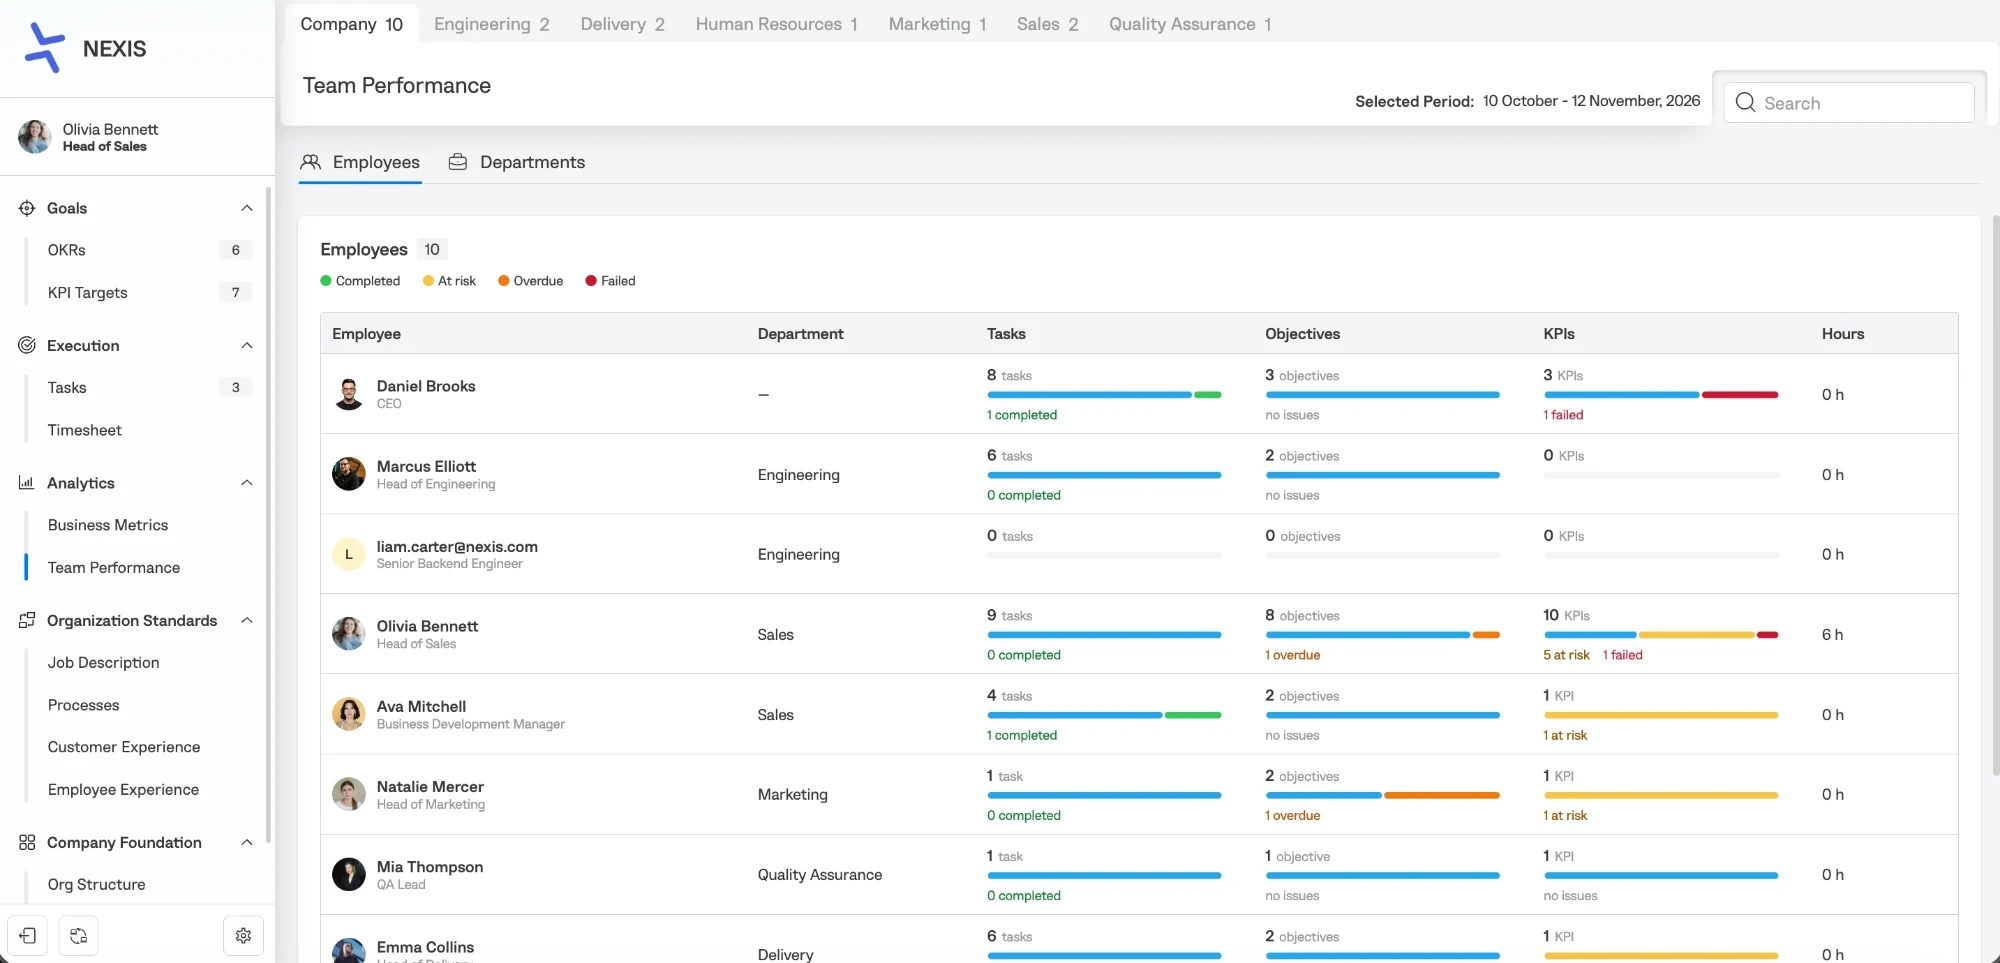
The Employees tab lists people in the order of your org structure, with their department, tasks, objectives, KPIs and hours. Each column has a bar coloured by status: completed, at risk, overdue and failed. Under it you see what needs attention, for example "1 at risk", "2 overdue" or "no issues".
One person's results
Click a person to open their results. This is the same view as the Performance tab in their employee profile. It shows:
- summary cards for Tasks, Objectives, KPIs and Hours logged
- Objectives: the person's role, number of key results, progress and status
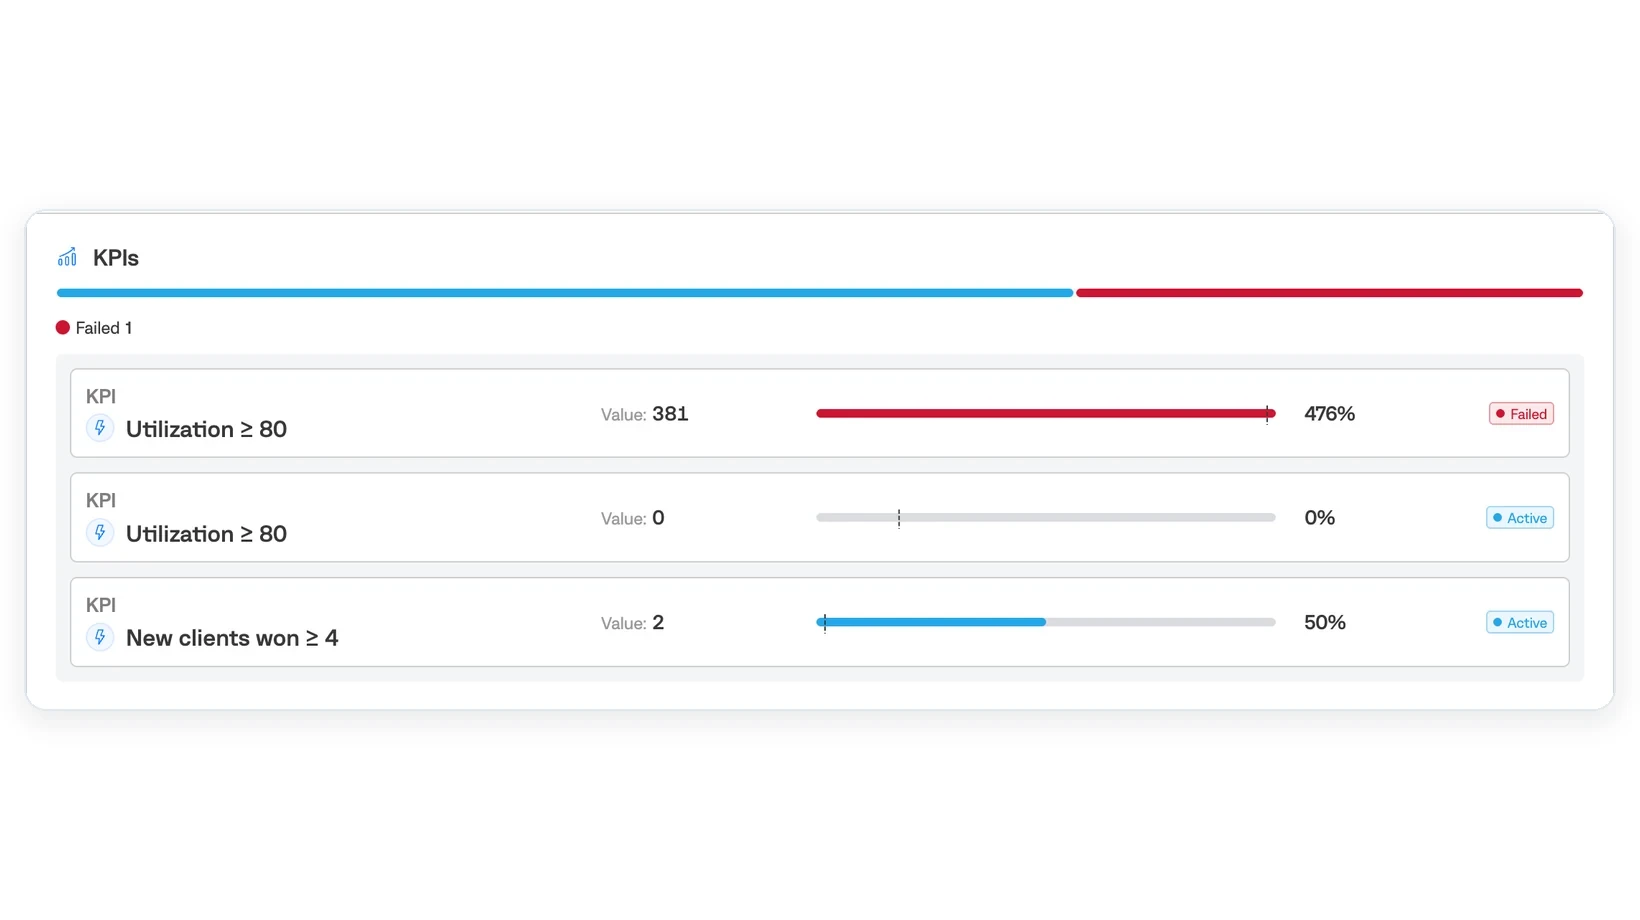
- KPIs: value, progress and status
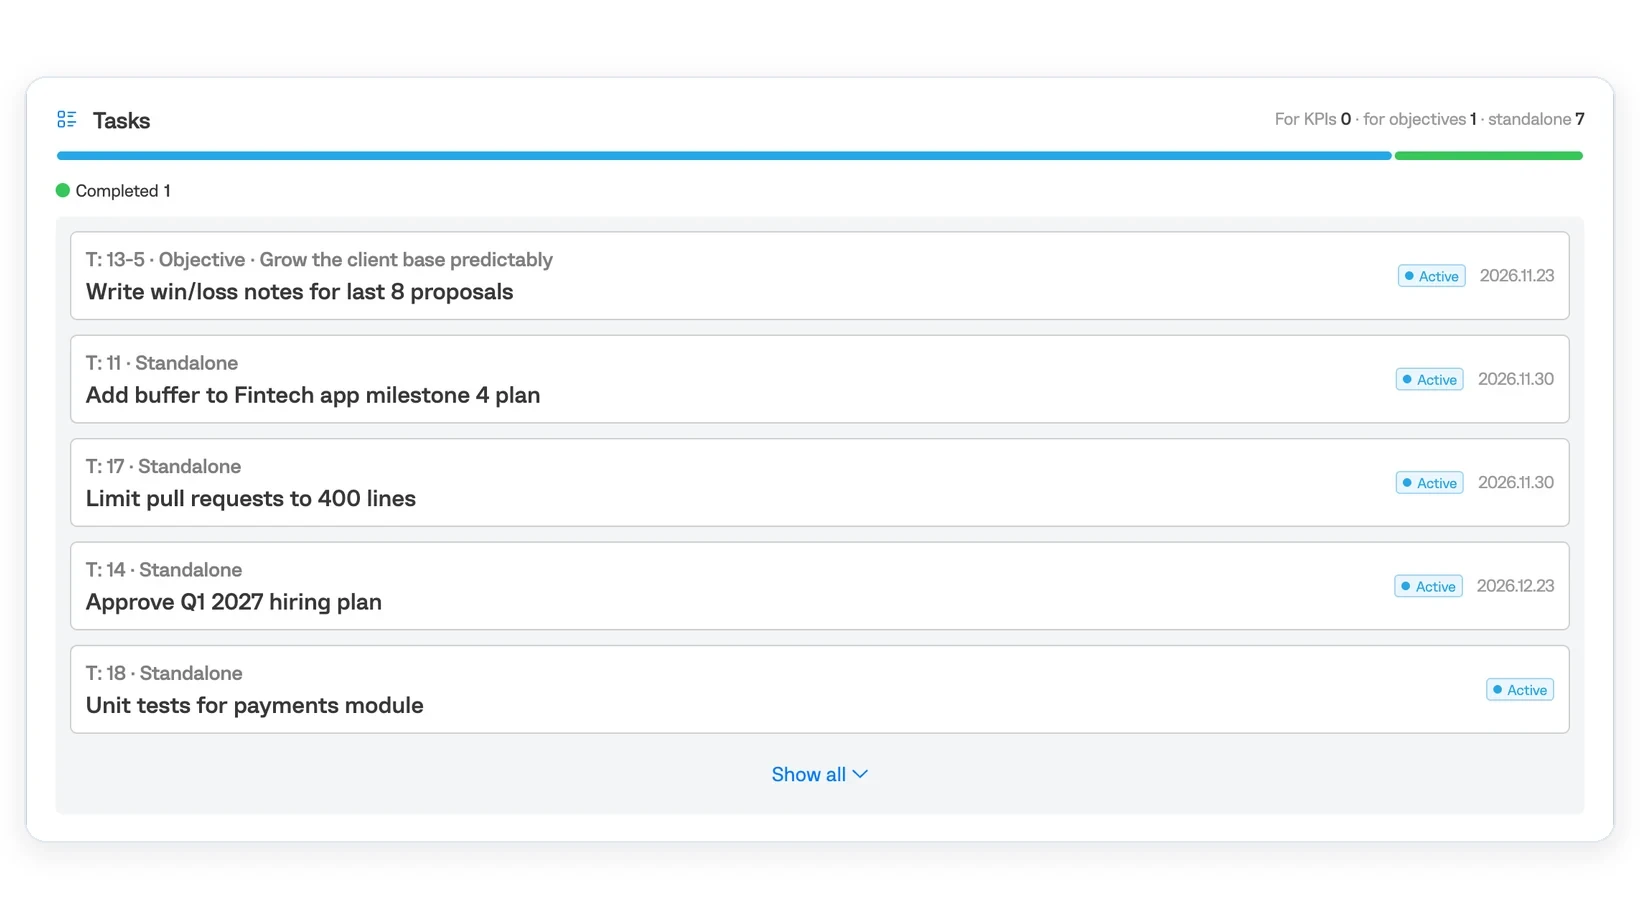
- Tasks: each with its objective or KPI, or Standalone, and how many serve KPIs, objectives or neither
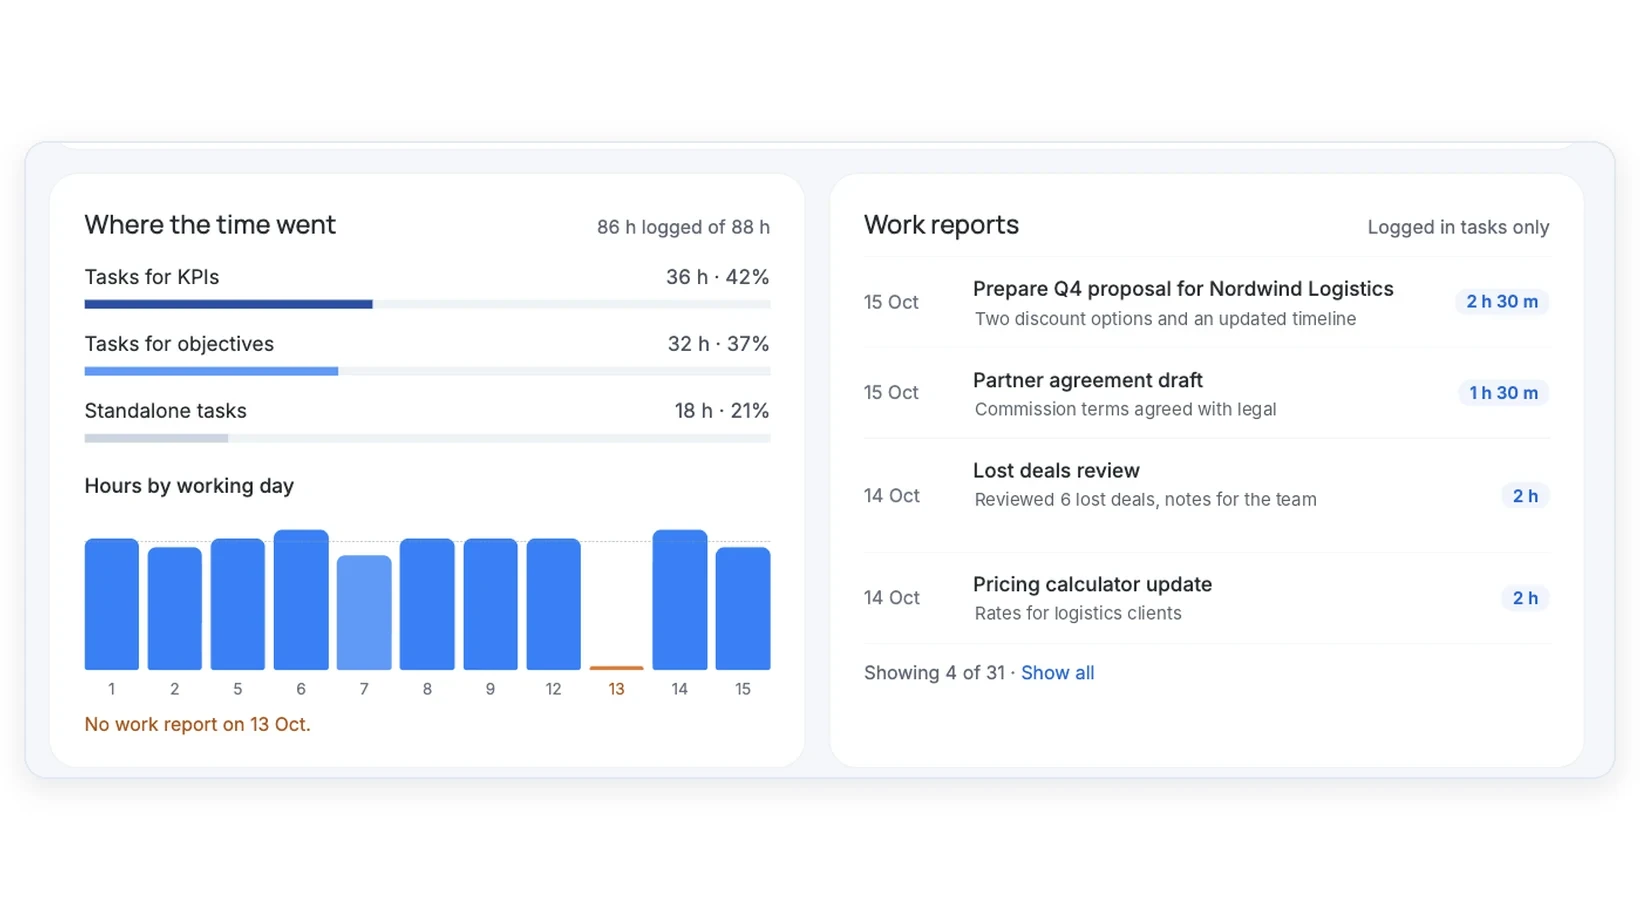
- Where the time went: hours on KPIs, on objectives and on standalone tasks
- Work reports: what the person logged, when and for how long
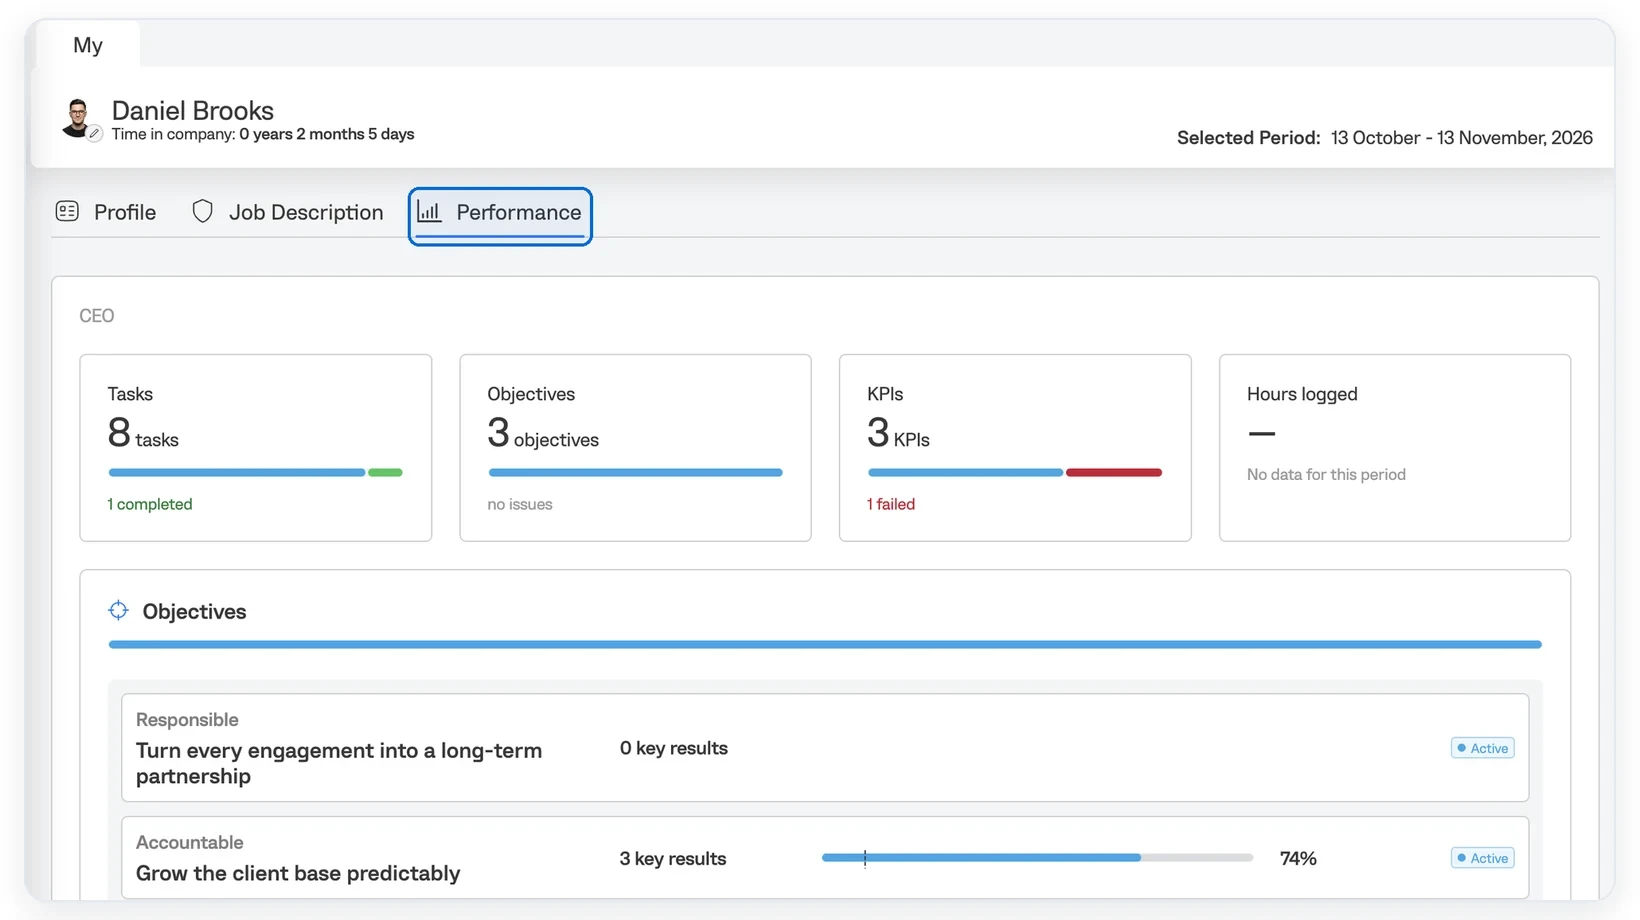
Before a one-on-one, a team lead can see that one objective is behind and that a fifth of the person's hours went to standalone tasks, and start the conversation there.
Departments
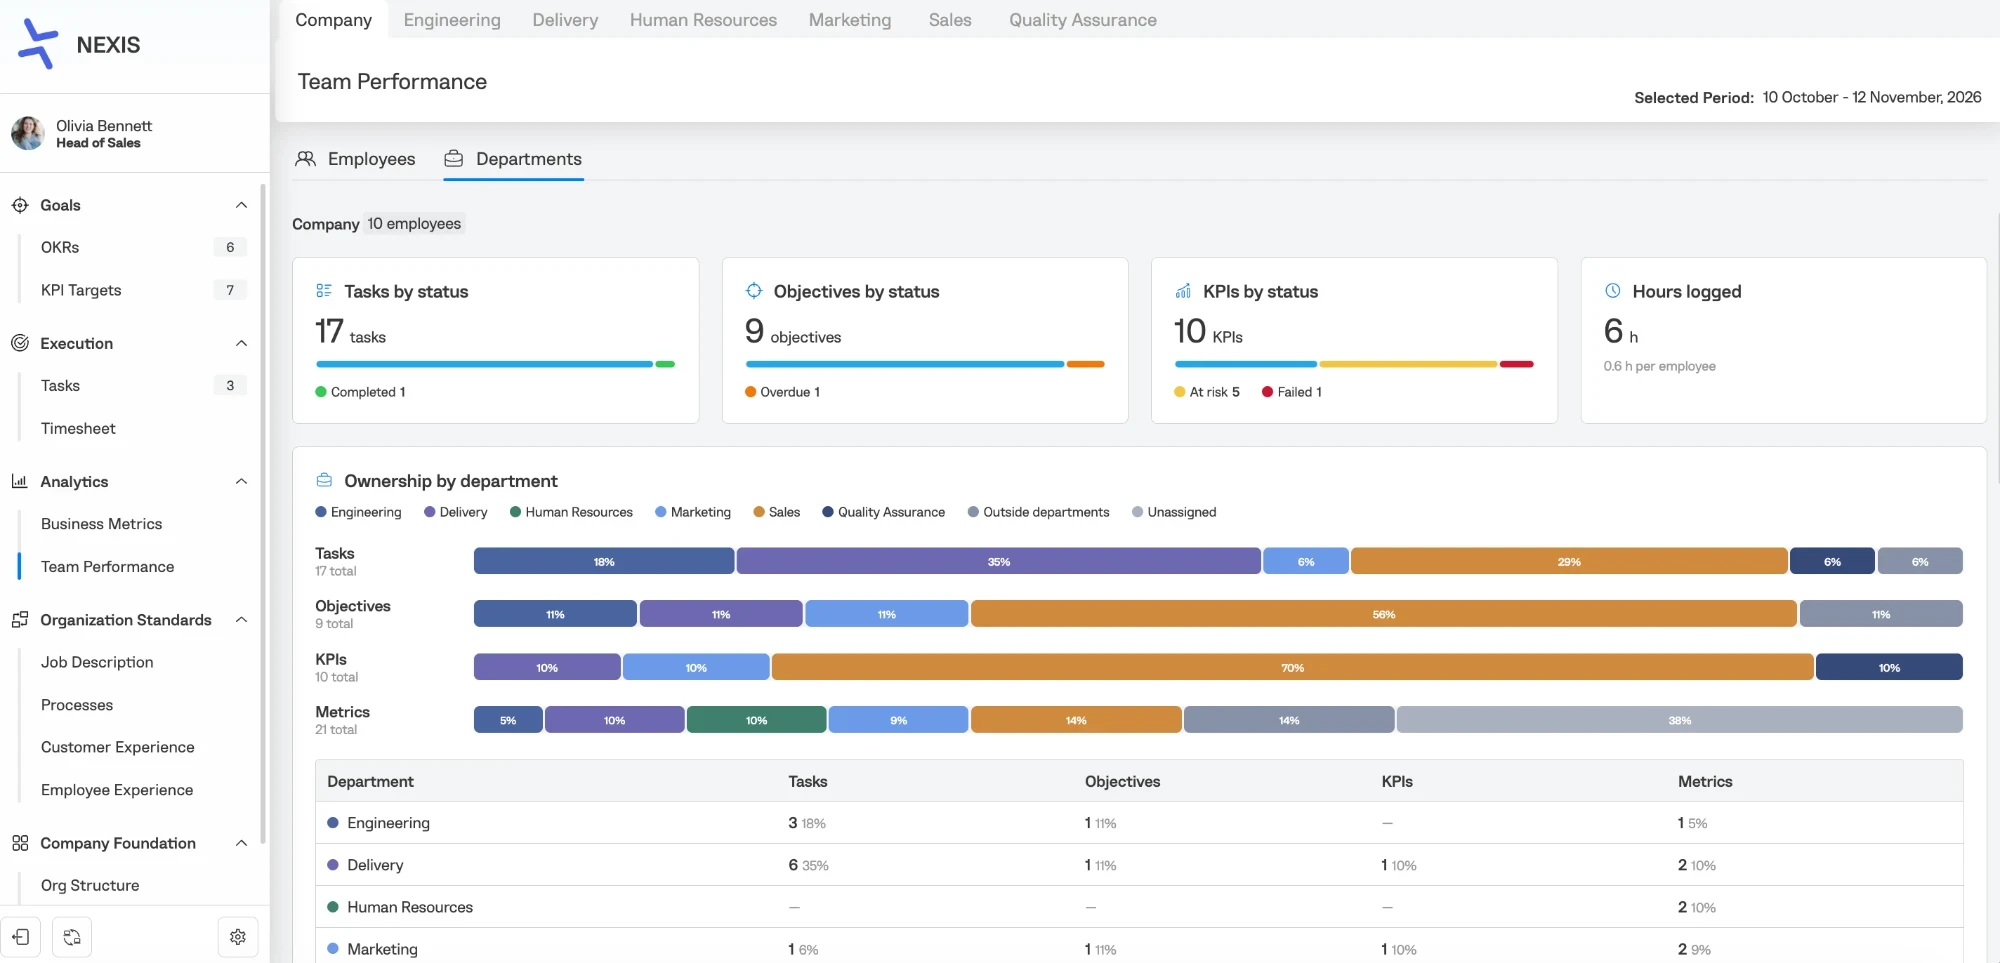
The Departments tab shows results for the whole company or one department, without names:
- Tasks by status, Objectives by status and KPIs by status
- Hours logged, with the average per employee
- Ownership by department: what share of tasks, objectives, KPIs and metrics each department owns, including items outside departments or unassigned
- department goals with progress, where the time went, Data discipline (whether metrics have data for the period) and signals
Where the time went
Every hour is logged inside a task, and every task belongs to a KPI, an objective or nothing. Team Performance shows how many hours were logged against the norm and splits them three ways:
- Tasks for KPIs: the regular work that keeps the business running
- Tasks for objectives: work that moves the company toward its goals
- Standalone tasks: work that doesn't move a KPI or objective
For example, 86 h logged of 88 h: 36 h (42%) for KPIs, 32 h (37%) for objectives, 18 h (21%) standalone.
Hours by working day shows the hours for each day of the period and marks days with no work report, for example No work report on 13 Oct.
Signals
Enforcium checks every department by the same rules and shows a signal when overdue tasks are growing, objectives are at risk, metrics have no data for the period, or time on standalone tasks is rising.
Work reports
Hours come from work reports added inside a task: what was done, how long it took and the date. The Work reports block lists them by date with their description and duration. For example: Prepare Q4 proposal for Nordwind Logistics, 2 h 30 m, 15 October. The time adds up to the task and, through it, to its KPI or objective. Hours are also collected in Execution → Timesheet.
Who sees what
Access follows the org structure. The Owner and Company Administrators see the whole company, managers see their branch, and people without reports see only their own results. The Departments tab shows totals only. See How access roles work.
Team Performance doesn't include performance reviews yet.